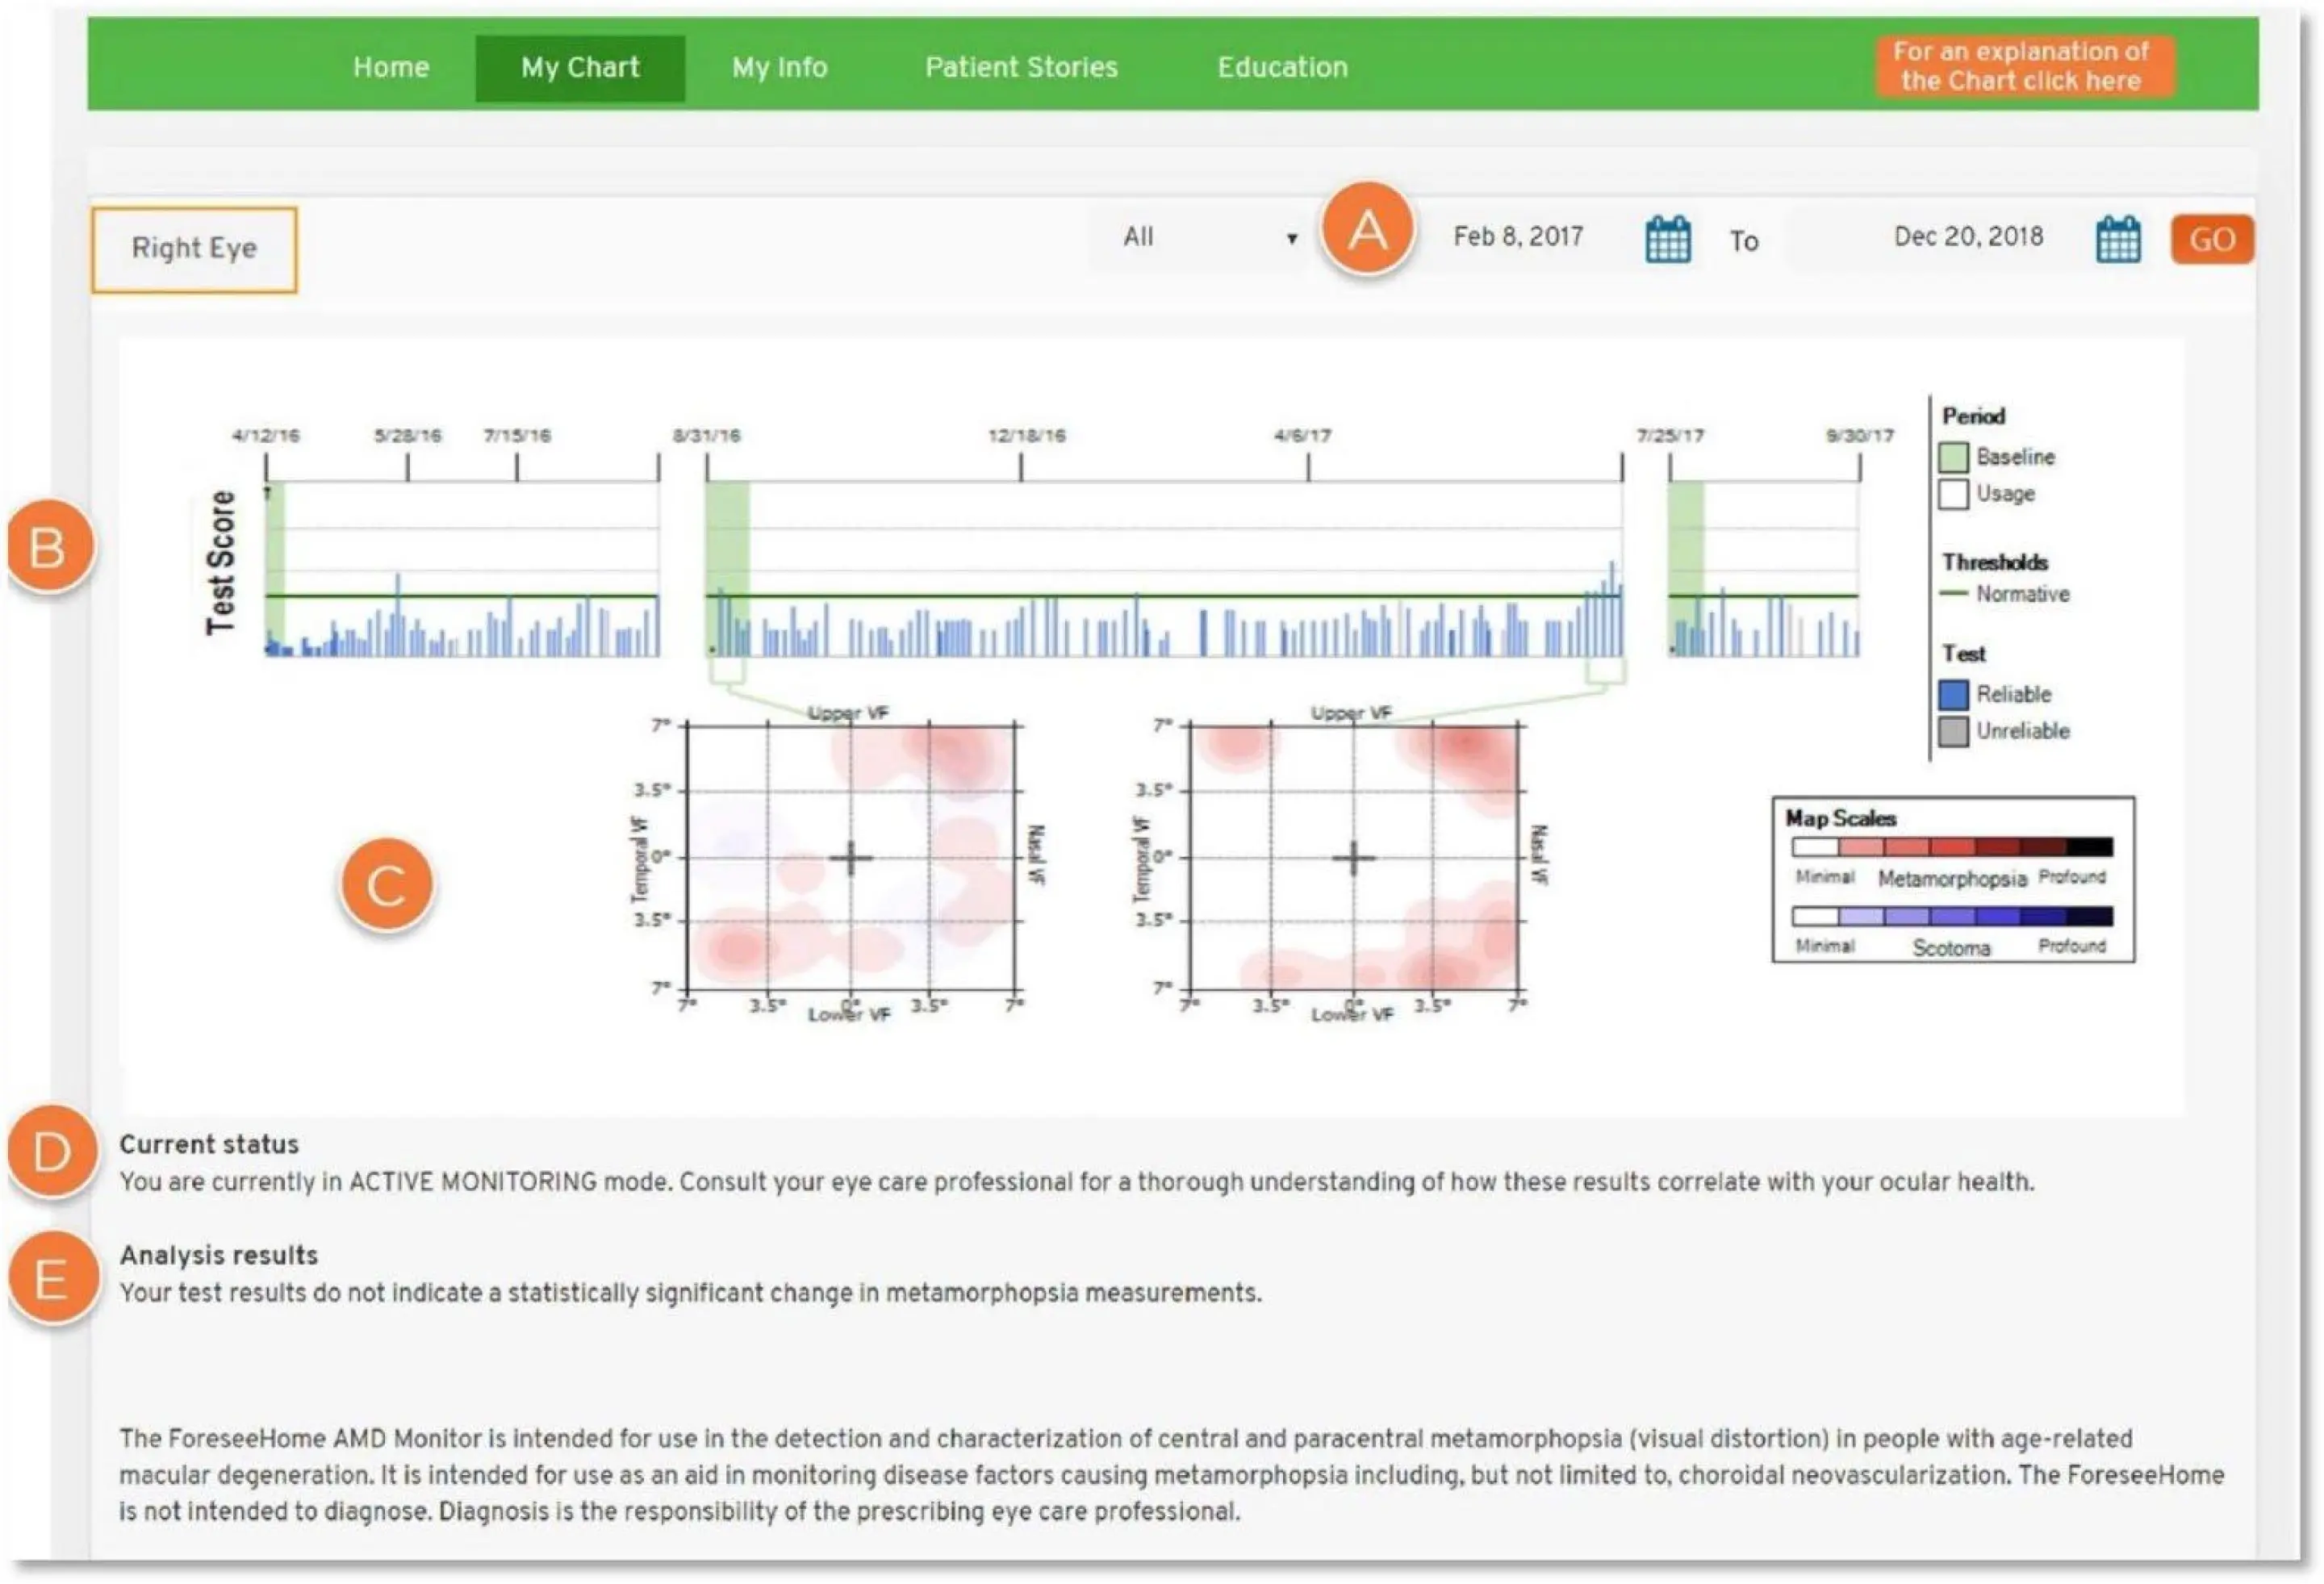
Now that you've been introduced to My Chart, giving you access to your routine monitoring data, we’ll take a closer look to help you better understand your personal window into the ForeseeHome AMD Monitoring Program.
Note: This is a sample chart and not reflective of your own chart

A. Date Selector: Allows you to select a specific testing period to view. You may view a specific date range or use the drop down to select a pre-set period.

B. Test Score Graph: Represents how your test results compare to a normative database as well as your own baseline.

- The shaded green section represents the baseline calculation period, or the period during which the ForeseeHome algorithm is learning the map of your retina as demonstrated by your test results. All your future tests are compared against this map for analysis.
- Each vertical bar along the bottom of the graph represents one test
o Blue bars indicate reliable tests
o Gray bars indicate unreliable tests
Unreliable tests provide inconsistent or insufficient data, and the test will not be used for analysis.
- The horizontal solid green line represents a threshold relative to the normative database and your baseline.
o If the height of the blue test bar is below the green line, this is an indication that your test results are within normal limits.
o If the height of the blue test bar is above the green line, this is an indication that the test results are outside normal limits.
- Minor inconsistencies are common when testing with the ForeseeHome device, and the algorithm is designed to accommodate these. It is possible for a single test result (one of the blue or gray bars) to cross the green line (i.e., fall outside normal limits) but the comprehensive results may still be considered normal.
o A series of consecutive tests measuring outside normal limits is required for a statistically significant change.
C. Metamorphopsia & Scotoma Maps: Provide a graphic representation of the metamorphopsia and scotoma associated with your test results over time.

Metamorphopsia is defined as visual distortion caused by irregularities in your retina. Scotoma is defined as visual absence caused by irregularities in your retina.
• The scales to the right of these maps indicate the corresponding extent of metamorphopsia and scotoma.
• It is common for normal subjects to have minimal amounts of metamorphopsia and scotoma and a minimal amount of variability over time.
D. Current Status: Describes your current testing status and will indicate one of the following modes:

- Establishing Baseline: The system is collecting your most recent results to formulate your baseline. If the system establishes a reliable baseline, your status will change from ESTABLISHING BASELINE to ACTIVE MONITORING.
- Active Monitoring: The system has established a reliable baseline, and your prescribed eye(s) is/are now being actively monitored.
E. Analysis Results: Indicates if there have been any recent statistically significant changes in your testing results. Should any changes be detected, the Notal Vision Monitoring Center notifies your referring eye doctor to review your testing results, and your doctor’s office may schedule a follow-up eye exam.

NOTE: Please consult your eye doctor to understand how your results correspond to your disease and eye health.
If you have questions about navigating My Chart, please call 888-910-2020 or email patientsupport@notalvision.com.